Legacy machines keep production moving, but they also carry some of the highest unmanaged risk on the shop floor. Many were built before modern safety standards existed, have been modified over the years without formal review, and lack the documentation needed to understand what hazards are actually present.
The challenge for safety managers is not simply finding the hazards. It is knowing where to start, what matters most, and how to build an improvement plan that works within real budget and production constraints.
A machine safety risk map is one of the most effective tools for doing exactly that. This guide walks through what a risk map is, why it matters for legacy equipment specifically, and how to build one that drives real action.
What Is a Machine Safety Risk Map?
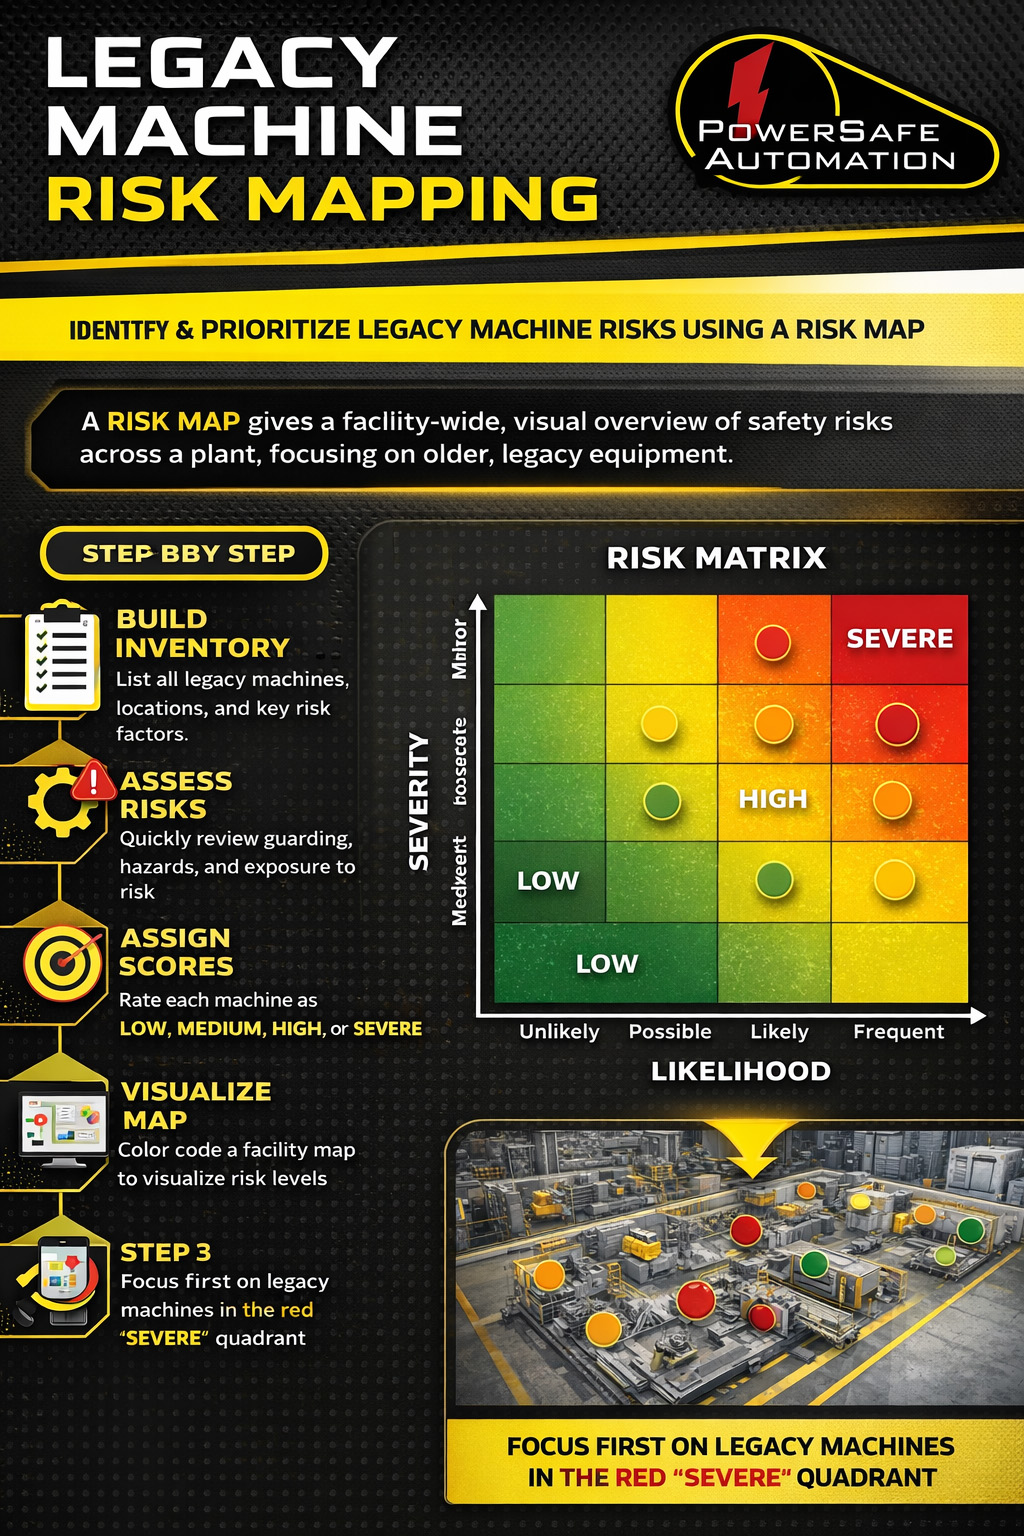
A risk map is a visual, data-driven overview of machine safety risk across your facility. Rather than evaluating machines in isolation, it gives you a facility-wide view that shows:
- Where hazards are concentrated
- Which legacy machines carry the highest risk
- How severity compares to frequency of operator exposure
- Where safety investments will have the greatest impact
Think of a risk map as the bridge between a walk-through safety audit and a fully engineered risk reduction roadmap. It does not replace a task-based risk assessment (TBRA), it determines where those detailed assessments should happen first.
Why Risk Mapping Matters for Legacy Machines
Legacy machines present unique challenges that make a structured risk mapping approach especially valuable.
Inconsistent Safety Design
Older equipment was often built before modern OSHA enforcement, ANSI B11, or ISO 13849 frameworks existed. This creates wide variability in risk levels, even across machines performing similar functions on the same floor.
Missing or Outdated Documentation
Many legacy machines have no electrical schematics, no safety circuit documentation, and no OEM manuals. Risk mapping helps prioritize where investigation efforts should begin before engineering time is committed.
Informal Modifications Over Time
Over decades, machines are reconfigured, relocated, and adjusted for productivity without a formal safety review. A risk map helps uncover the hidden risk that accumulates through well-intentioned changes.
Limited Capital Budgets
Most facilities cannot address everything at once. A risk map gives leadership the data needed to phase improvements intelligently, defend safety spending, and avoid reactive investments driven by incidents rather than strategy.
Risk Map vs. Task-Based Risk Assessment
These two tools serve different purposes and work best in sequence.
| Risk Map | Task-Based Risk Assessment (TBRA) | ||
| Facility-level view | Machine-specific analysis | ||
| Visual and comparative | Detailed and analytical | ||
| Prioritization tool | Design and compliance tool | ||
| Faster to implement | More resource-intensive | ||
| Guides planning | Guides engineering |
Best practice: Build the risk map first, then deploy TBRAs strategically where they deliver the most value.
How to Create a Risk Map for Legacy Machines
Step 1: Build a Complete Machine Inventory
Start with a comprehensive list of machines, including:
- Machine name and ID
- Location on the floor
- Primary function
- Approximate age and OEM (if known)
- Known modification history
Include production equipment, conveyors, test stands, manual workstations with powered motion, and any custom or one-off machines. If it moves, rotates, presses, cuts, or creates a trap point, it belongs on the list.
Step 2: Define Consistent Risk Criteria
Your scoring approach needs to be standardized so comparisons across machines are meaningful. Common criteria include:
Your risk map should be consistent and repeatable. Common criteria include:
- Severity of potential injury
- Frequency of operator exposure
- Probability of occurrence
- Number of operators affected
- Presence or absence of safeguarding
- Bypass or defeat potential
This does not require a full ISO risk calculation, but it does require consistency.
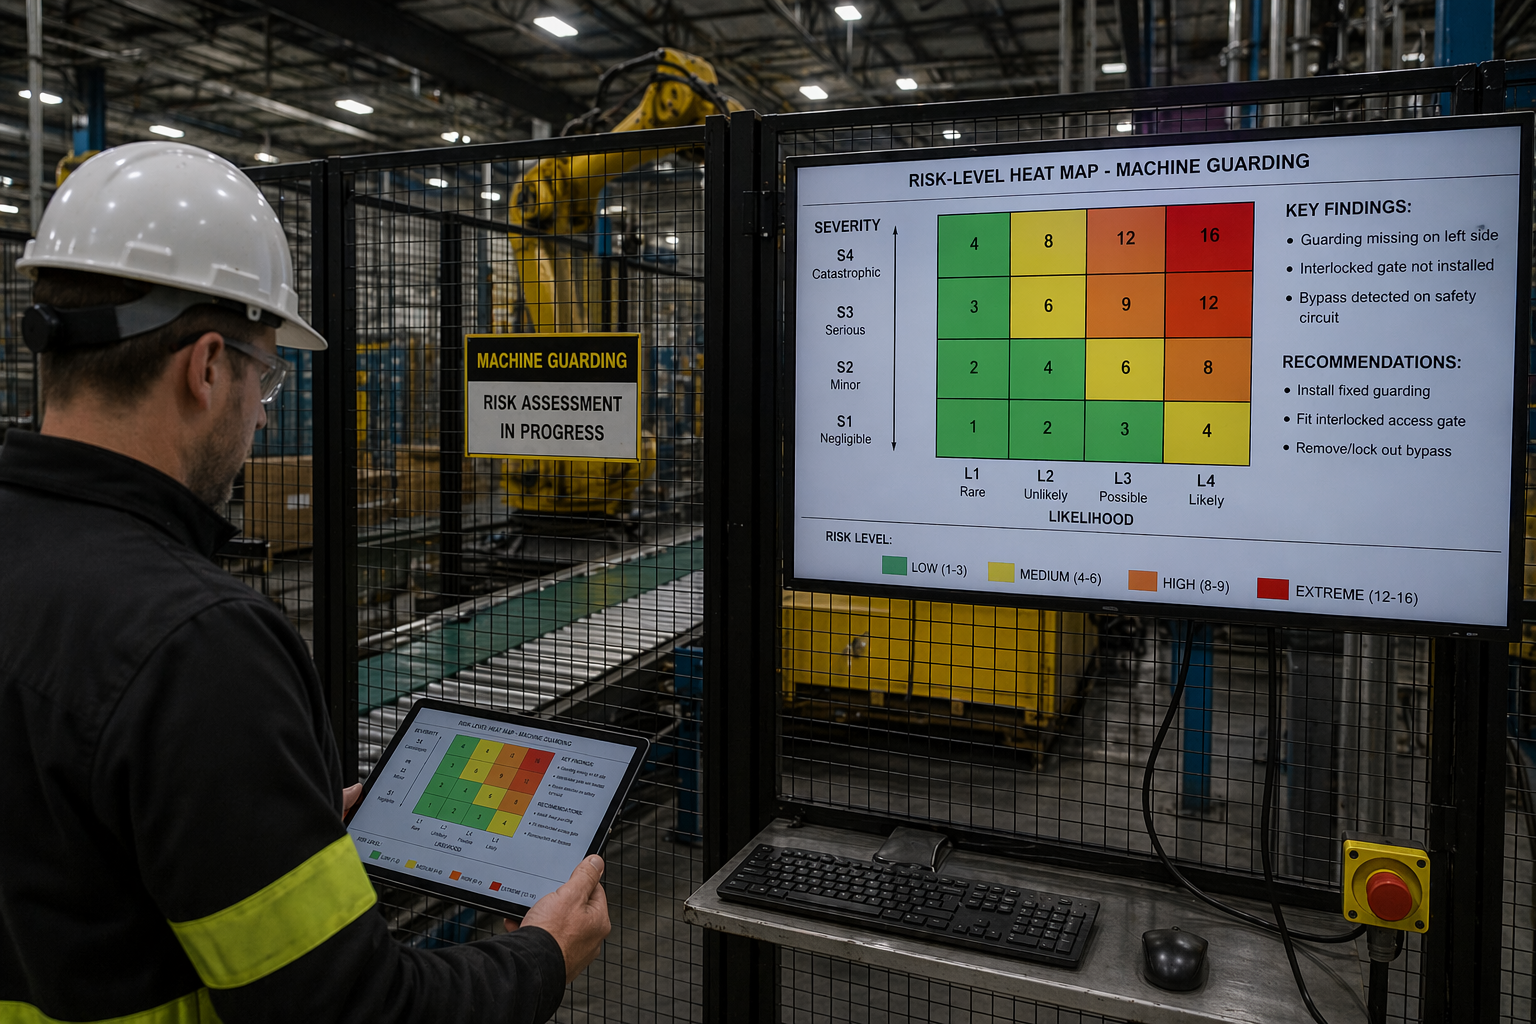
Step 3: Conduct a High-Level Hazard Review
Walk through each machine and document
- Unguarded pinch points and exposed rotating components
- Inadequate point-of-operation guarding
- Unsafe access during normal operation
- Manual intervention requirements
- Obsolete or defeated safety devices
Capture photos and notes. This visual record becomes essential when communicating risk to leadership and operations.
Step 4: Assign a Relative Risk Score
Use a simple, defensible system - Low / Medium / High / Severe, or a numeric scale. The goal is relative ranking across machines, not engineering precision at this stage.
The most common mistake at this stage is waiting for perfect data instead of moving forward with actionable insight.
Step 5: Visualize and Communicate the Map
Once scores are assigned, present the data visually:
- A spreadsheet dashboard or ranked machine list
- A heat map overlay on your facility layout
- Color-coded machine groupings by risk level
This visualization becomes the primary communication tool for leadership, engineering, operations, maintenance, and EHS. The risk map gives every team a shared picture of where risk lives.
Turning the Risk Map into a Safety Improvement Plan
A risk map only delivers value when it leads to action. Use it to structure a phased improvement plan:
Phase 1: Immediate Risk Reduction (0–90 Days)
Focus on the highest severity and highest exposure machines. Target:
- Low-complexity guarding fixes
- Simple barriers and enclosure solutions
- Restoration of defeated safety devices
These actions often deliver significant risk reduction quickly, without major downtime or capital investment.
Phase 2: Engineered Solutions (3–12 Months)
Address machines requiring:
- Interlocked guarding systems
- Presence-sensing devices (light curtains, area scanners)
- Safety PLC upgrades
- Functional safety validation
- Electrical documentation and safety circuit review
This is where task-based risk assessments (TBRAs) typically make the most sense.
Phase 3: Long-Term Modernization (12–24+ Months)
Plan for:
- Obsolete equipment nearing end of life
- Machines with chronic injury history
- Equipment incompatible with modern safeguarding
- Automation or redesign opportunities
Risk mapping ensures these larger projects are planned proactively, not driven by incidents.
Common Mistakes to Avoid
Don't treat the risk map as a compliance document.
It is a planning tool, not a certification.
Don't ignoring production reality.
Solutions need to work within uptime, throughput, and operator workflow constraints.
Don't over-engineering too early.
Not every machine needs a full Performance Level calculation in the first phase.
Don't forget to revisit the map.
Risk maps should be reviewed annually or after major equipment changes.
Don't Neglect the Risk of Legacy Machine
Legacy machines are not going away. But unmanaged risk does not have to stay.
A well-executed risk map creates clarity, builds alignment across teams, and gives safety leaders the foundation they need to defend investments and drive real improvement, one prioritized machine at a time.
Ready to assess the legacy machine risk in your facility? Contact PowerSafe Automation to learn how our team can support your safety improvement strategy.